
How to Detect Null Pointer Dereference Bugs in Production
Null pointer dereferences hide in silent service restarts and ambiguous error codes rather than loud crash dumps, making them difficult to trace without structured logging.
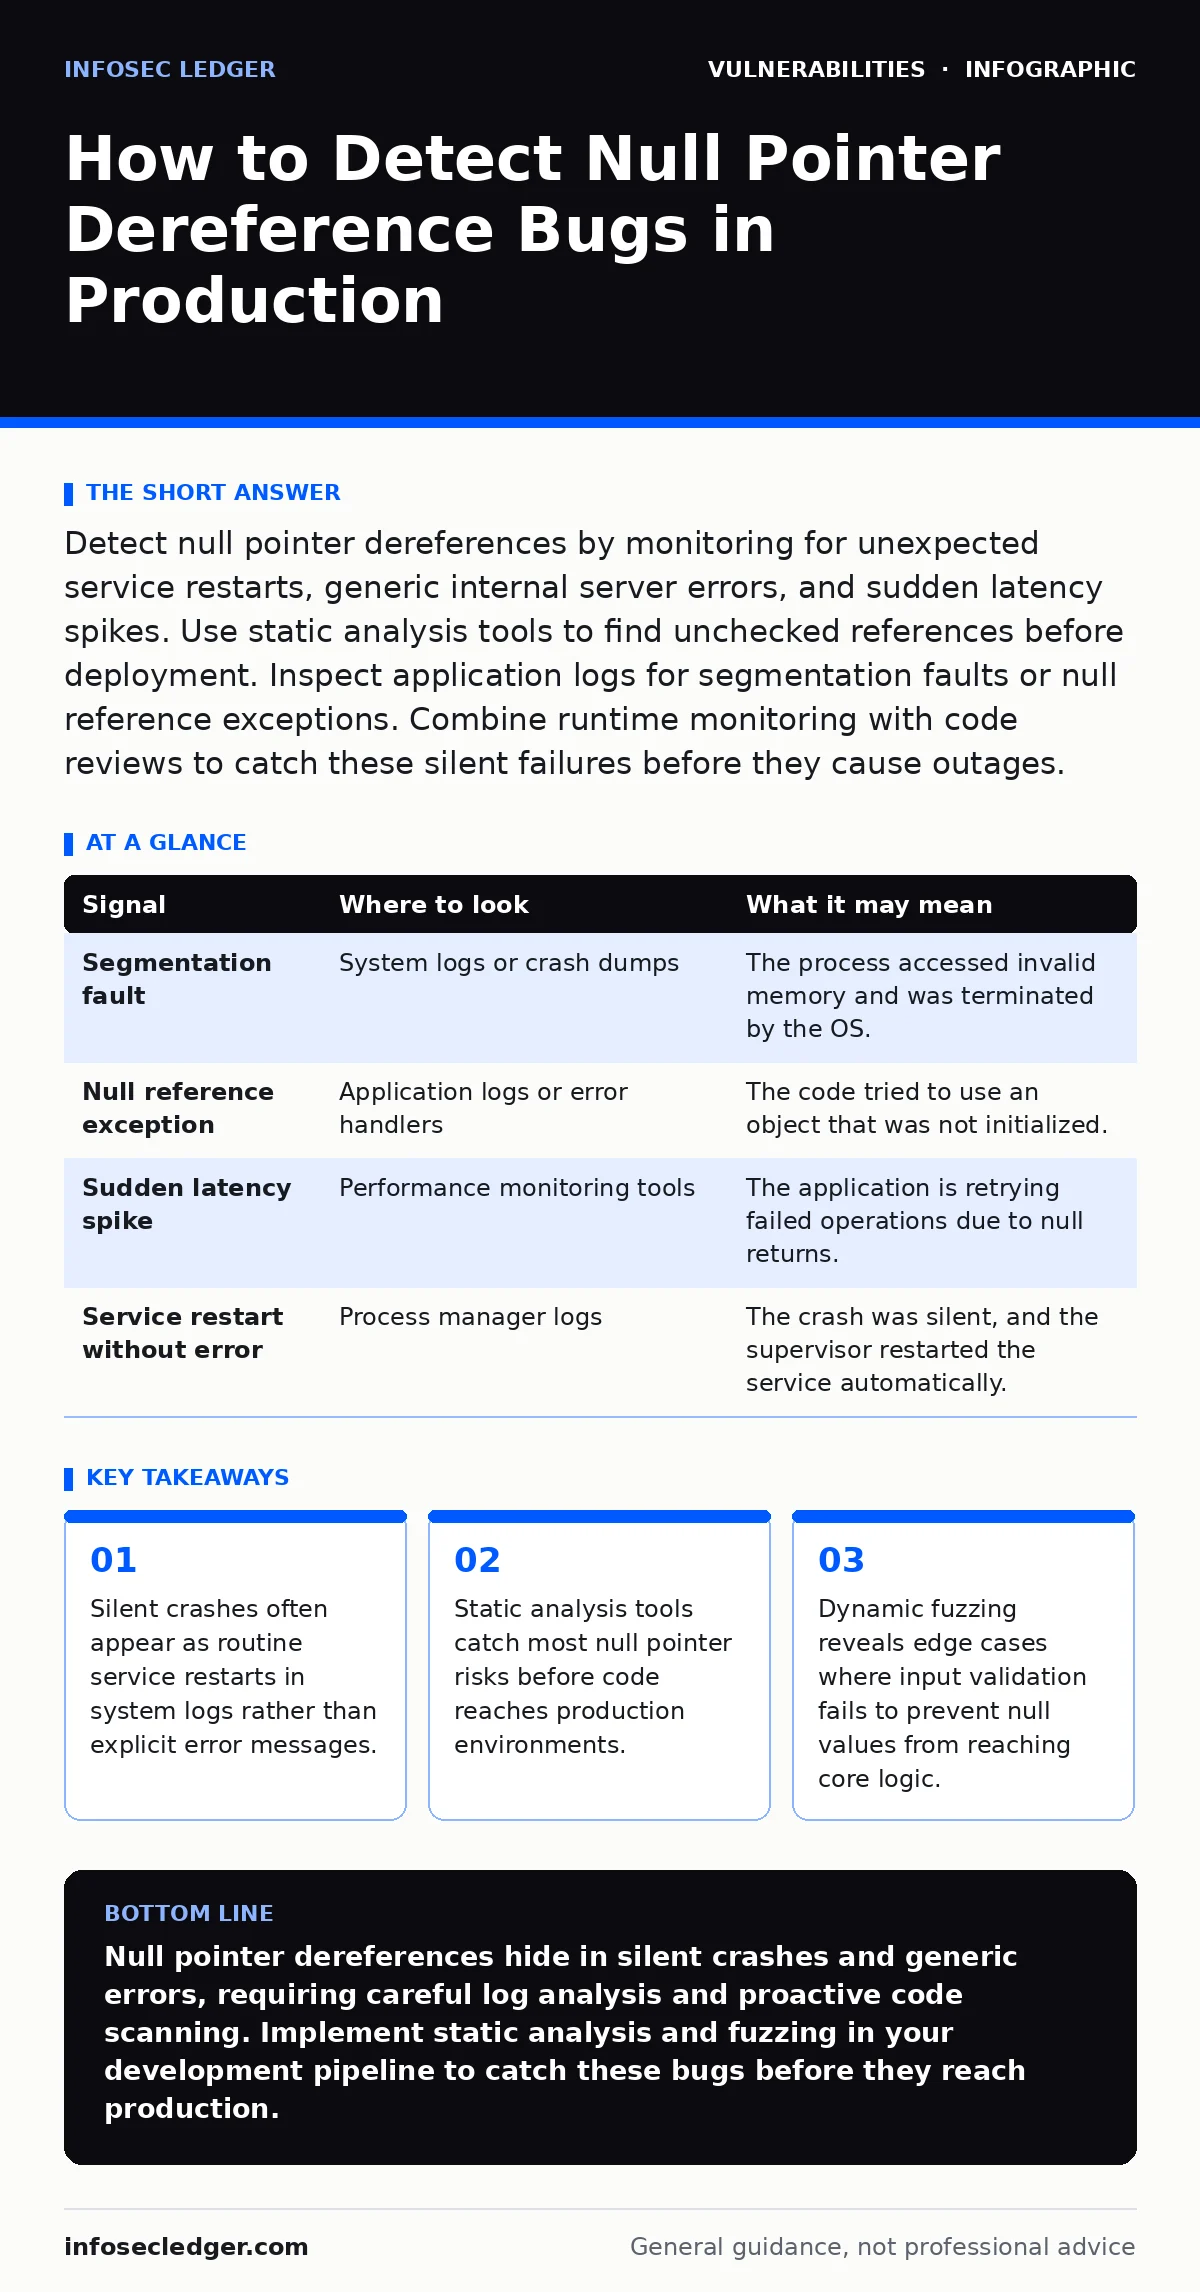
Detect null pointer dereferences by monitoring for unexpected service restarts, generic internal server errors, and sudden latency spikes. Use static analysis tools to find unchecked references before deployment. Inspect application logs for segmentation faults or null reference exceptions. Combine runtime monitoring with code reviews to catch these silent failures before they cause outages.
Understanding the Mechanism of Null Pointer Dereference
A null pointer dereference occurs when software attempts to access memory through a pointer that does not reference a valid object. This happens when a function returns a null value to indicate failure, but the calling code ignores that return value. The program then tries to read or write data at memory address zero. This action violates memory protection rules. The operating system terminates the process immediately. You see this as a crash or a hang. It is one of the most common causes of software instability. The bug exists because the developer assumed a resource would always be available. That assumption fails under load or during configuration errors.
Signals in Application Logs
Application logs provide the first line of evidence for these bugs. Look for segmentation faults or null reference exceptions in your logs. These entries often appear just before a service restarts. The timestamp of the crash matches the start time of the new process. Check for generic error codes like 500 Internal Server Error. These codes often mask the underlying null pointer issue. If your application uses structured logging, search for stack traces that mention null. These traces point directly to the line of code that failed. Without structured logging, you must correlate crash times with recent deployments. This correlation helps isolate the new code that introduced the risk.
| Signal | Where to look | What it may mean |
|---|---|---|
| Segmentation fault | System logs or crash dumps | The process accessed invalid memory and was terminated by the OS. |
| Null reference exception | Application logs or error handlers | The code tried to use an object that was not initialized. |
| Sudden latency spike | Performance monitoring tools | The application is retrying failed operations due to null returns. |
| Service restart without error | Process manager logs | The crash was silent, and the supervisor restarted the service automatically. |
Tools for Static Analysis
Static analysis tools examine your source code without running it. These tools look for patterns that often lead to null pointer dereferences. They check if every function call that can return null is properly handled. The tool flags lines where a variable might be null when accessed. You should run these tools in your continuous integration pipeline. This ensures every new change is checked before merging. Some tools use data flow analysis to track null values from their source to their usage. This method catches bugs that simple pattern matching misses. You must configure the tool to match your coding standards. False positives are common if the tool does not understand your codebase.
Dynamic Testing with Fuzzing
Static analysis cannot catch every bug. Dynamic testing runs the software with random or malformed inputs. Fuzzing tools generate thousands of inputs to trigger edge cases. These inputs might cause a function to return null unexpectedly. The fuzzer monitors the application for crashes or hangs. When a crash occurs, the fuzzer saves the input that caused it. You can replay this input to reproduce the bug. This method finds bugs that static analysis misses. It tests the actual runtime behavior of your code. You should fuzz any component that processes external input. This includes APIs, file parsers, and network handlers. Fuzzing reveals how your code behaves under stress.
Monitoring System Behavior
System monitoring tools track the health of your running services. Look for unexpected restarts of your application processes. A process that restarts frequently is likely crashing. Check the exit codes of these processes. Exit code 139 often indicates a segmentation fault. This code is specific to null pointer dereferences on Linux systems. Monitor memory usage for sudden drops.
A crashed process releases all its memory immediately. This drop appears as a spike in available memory. Correlate these memory spikes with log entries. This correlation confirms that a crash occurred. You must set up alerts for these specific patterns. Generic uptime monitors miss these short crashes. They only report if the service is down for a long time.
See also: Prevent sudo vulnerabilities: 3 configuration fixes that stop privilege escalation · Prevent npm Package Vulnerabilities: A Technical Prevention Checklist
Common Blind Spots in Detection
Many teams miss null pointer bugs because they focus on the wrong areas. One blind spot is third-party libraries. You might trust that a library handles null correctly. That trust is often misplaced. The library might return null in rare conditions. Your code must still check for null. Another blind spot is asynchronous code. When a callback runs later, the object it references might be null. The timing of the null check matters. If you check null before the object is created, you miss the bug. You must check null at the point of use. Not at the point of creation. This distinction is critical for concurrent systems.
Integrating with Security Practices
Null pointer dereferences can be exploited for denial of service. An attacker sends specific inputs to trigger the crash. This stops your service from responding to legitimate users. You should treat these bugs as security issues. Not just reliability issues. Include null pointer checks in your security reviews. Look for functions that handle user input.
Ensure these functions validate all inputs. If validation fails, return a clear error. Do not let the code proceed with null values. This practice reduces the attack surface. It also improves the stability of your application. Security teams should collaborate with developers. They can help identify high-risk areas. These areas need extra testing and monitoring.
Related Vulnerability Considerations
Null pointer bugs often coexist with other vulnerabilities. For example, a null pointer might expose sensitive data in error messages. This information helps attackers plan further attacks. You should review your error handling carefully. Ensure it does not leak stack traces or memory addresses. This practice protects against information disclosure. You might also want to review your configuration for related risks. See the guide on unpatched software for best practices on keeping dependencies secure.
Outdated libraries often contain known null pointer bugs. Patching these libraries removes the risk. You should also check your network configuration. See the guide on vulnerabilities in VPN gateways and application delivery controllers to ensure your infrastructure is secure. These devices might crash under similar conditions. Finally, review your identity management. See the guide on OAuth misconfigurations to ensure your authentication flow is robust. Flaws here can lead to null pointers in user session handling.
Key takeaways
- Silent crashes often appear as routine service restarts in system logs rather than explicit error messages.
- Static analysis tools catch most null pointer risks before code reaches production environments.
- Dynamic fuzzing reveals edge cases where input validation fails to prevent null values from reaching core logic.
Null pointer dereferences hide in silent crashes and generic errors, requiring careful log analysis and proactive code scanning. Implement static analysis and fuzzing in your development pipeline to catch these bugs before they reach production.
Frequently asked questions
Can null pointer dereferences be exploited for remote code execution?
Rarely, but it is possible if the attacker can control the memory layout. Most often, these bugs cause denial of service by crashing the application.
How do I distinguish a null pointer crash from other crashes?
Look for segmentation faults or null reference exceptions in logs. Check for exit code 139 on Linux systems. These signals are specific to memory access violations.
Do modern programming languages prevent these bugs?
Languages like Rust and Java prevent most null pointer dereferences at compile time or runtime. However, unsafe code blocks or unchecked casts can still introduce these risks.
Should I disable core dumps to hide crash details?
No, core dumps help developers diagnose the root cause. Instead, restrict access to core dumps and ensure they do not contain sensitive data.
How this guide was produced: written by the InfoSec Ledger editorial team with AI assistance, checked against the public references listed below, and reviewed when the facts change. See our editorial policy or report an error.